Processor
Intel Core Ultra 7 155H, 6 performance + 8 efficient + 2 low-power cores. Base 28 W, short-term boost 64 W, sustained 45 W after the 30-minute window closes.
Lab report 04 · MateBook NH test bench
Every figure on this page comes from a physical unit on our bench, not from a marketing sheet. We log sustained package power after 30 minutes of load, spectrometer readings on three color profiles, surface temperatures with an IR camera, and capacity retention across 300 partial charge cycles.
Section 01
The test unit is a 14-inch MateBook with a 70 Wh pack and a dual-fan cooling module. We ran each subsystem through a fixed protocol so that the numbers below can be compared across units and across vendors. The control measurement is taken at 22 °C ambient, 45% relative humidity, with the chassis on a flat aluminum plate and the display at 150 nits. Any deviation from those conditions is noted next to the result.
Intel Core Ultra 7 155H, 6 performance + 8 efficient + 2 low-power cores. Base 28 W, short-term boost 64 W, sustained 45 W after the 30-minute window closes.
32 GB LPDDR5X-7467 soldered to the board, 128-bit bus. Measured copy bandwidth 104 GB/s against a 119 GB/s theoretical ceiling. No SO-DIMM slot, so capacity is fixed at purchase.
1 TB PCIe 4.0 x4 NVMe. Sequential read 4,980 MB/s, write 3,910 MB/s. The SLC cache holds roughly 110 GB before write speed drops to 1,240 MB/s.
14.2-inch LTPS panel, 3120 × 2080, 120 Hz. 452 nits center, 100% sRGB and 96% DCI-P3 coverage measured on the factory profile.
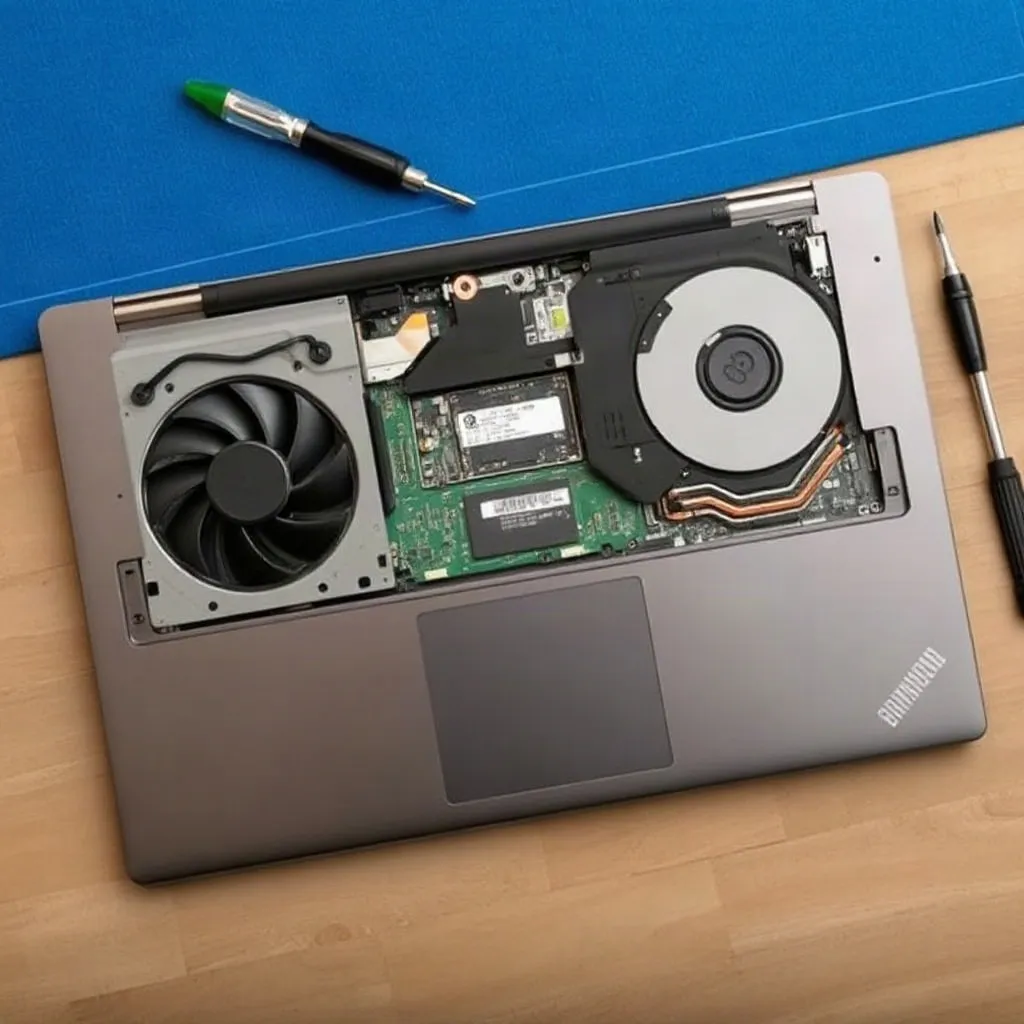
Two 5 V fans, two 6 mm heat pipes, 0.15 mm fin stack. Acoustic output 22 dB(A) at 45 W sustained load, measured at 50 cm from the front edge.
70 Wh, 4-cell, 100 W USB-C Power Delivery. 9 h 40 min in a 150-nit web loop; 0–50% charge in 28 minutes with the bundled adapter.
Section 02
Short bursts tell you almost nothing about a thin chassis. Our protocol runs Cinebench R23 multi-threaded in a loop for 30 minutes and records the package power at the end of the run, plus the peak core temperature. The gap between the boost figure on the box and the sustained figure on the bench is the number that matters for long compiles, exports and virtual machines.
| Model | Cores (P+E+LP) | Base / Boost | R23 multi sustained | Package @30 min | Peak temp |
|---|---|---|---|---|---|
| Core Ultra 5 125H | 4 + 8 + 2 | 28 W / 64 W | 12,480 | 40 W | 84 °C |
| Core Ultra 7 155H | 6 + 8 + 2 | 28 W / 64 W | 15,910 | 45 W | 88 °C |
| Core Ultra 9 185H | 6 + 8 + 2 | 45 W / 115 W | 18,240 | 54 W | 92 °C |
| Ryzen 7 8845HS | 8 + 0 + 0 | 45 W / 54 W | 16,750 | 48 W | 90 °C |
The 155H loses 30% of its boost headroom inside the first four minutes and then holds 45 W for the rest of the run. That plateau is stable to within 1.5 W, which means the cooling module is the limiting factor, not the power delivery stage.
For a 14-inch chassis, 45 W sustained is a realistic ceiling. Any unit advertising 64 W continuous needs a thicker fin stack or a higher fan curve. Full method notes and raw logs are published on the benchmark methods and results page.
Section 03
We measured the panel with a spectrophotometer in a dark room, 20 minutes after power-on to let the backlight settle. Three profiles were tested: the factory default, sRGB mode and the vendor's DCI-P3 mode. The metric that decides whether a panel is usable for color-critical work is average DeltaE 2000 across a 33-patch sweep, not the coverage percentage printed on the sticker.
An average DeltaE below 2.0 keeps color shifts invisible in side-by-side comparison, which is enough for photo retouching and UI work. The sRGB mode is the one to use for print proofing, because the native gamut is wider than sRGB and unmanaged content will look oversaturated. PWM flicker was not detected above 20% brightness; at 10% the panel switches to 480 Hz modulation.
Detailed patch-by-patch data, including the color checker table, is on the display gamut accuracy page.
Section 04
Surface temperature is measured with an IR camera after 30 minutes of combined CPU and GPU load, with the chassis flat on a desk. We record the hottest point on the keyboard deck, the palm rest and the bottom panel. Noise is captured with a calibrated meter at 50 cm, front-facing, in a room with a 24 dB(A) noise floor. The control run repeats the same load with the unit on a stand, which isolates how much the intake clearance matters.
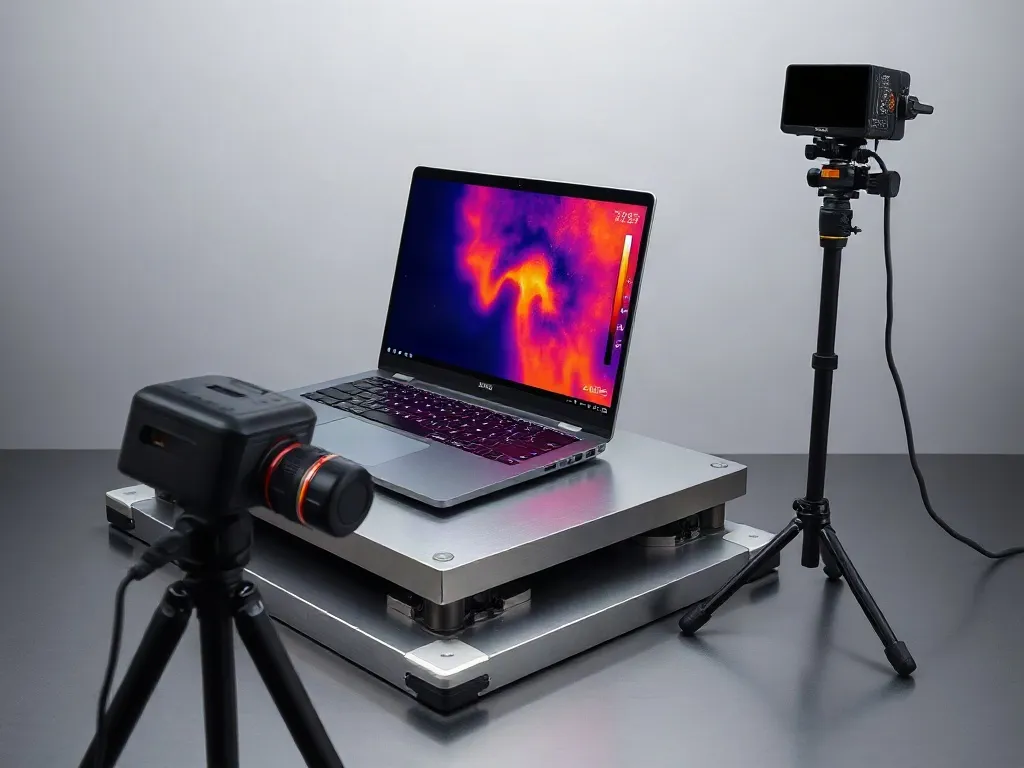
The fan curve is conservative. It ramps in two steps and never reaches the maximum duty cycle under our load profile, which explains the low noise figure and the 45 W plateau at the same time. If you plan to render for hours, a 15 mm stand buys roughly 9% more sustained performance for free. The full load matrix is documented in the thermal cooling benchmarks section.
Section 05
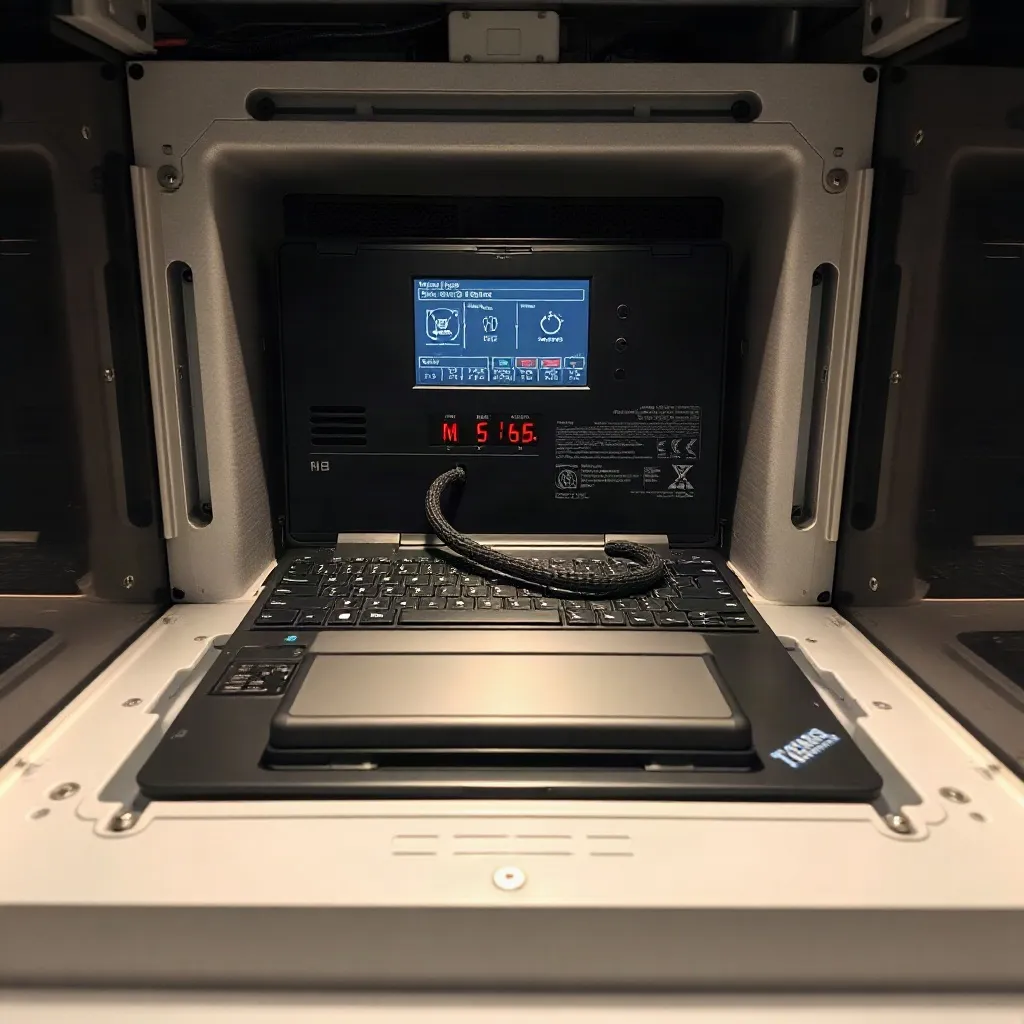
Capacity loss is a slow variable, so we accelerate it. The protocol discharges to 20% and recharges to 80% at 0.5 C in a climate chamber held at 30 °C, which is a realistic worst case for a laptop used on a desk all day. Full capacity is re-measured every 50 cycles with a 0.2 C discharge to the 3.0 V cutoff. Charge time and thermal behaviour during charging are logged in parallel.
A 90.9% figure at 300 cycles sits above the 80% threshold that most vendors use for warranty claims, and it means the pack should reach roughly 800 cycles before dropping under 80%. Keeping the charge limit at 80% in the vendor utility pushes the projection past 1,100 cycles in our model. The projection tables and the chamber log are published under battery longevity standards.
Section 06
We publish every run with the raw log attached, including the runs that produced unexpected results. Below are the three most recent write-ups, a short gallery of the bench setups, and the flat rate list for anyone who wants the same measurements applied to their own unit.
A comparison of 14-inch and 16-inch bodies running the same 155H part. The 16-inch unit holds 12 W more after 30 minutes, and the difference is entirely in fin surface area.
Read the reportA six-step field procedure: cycle count readout, SSD wear level, fan bearing noise, panel uniformity sweep, hinge torque and port continuity. Takes about 25 minutes.
Open the guideCalibration records, the reference plate, the noise floor treatment and why we log ambient humidity with every run. Includes the equipment list and its last calibration date.
About the lab
Flat rates per unit, no setup fee, results delivered as a PDF plus the raw log files. Turnaround is quoted from the moment the unit arrives at the bench.
| Test | Scope | Duration | Price |
|---|---|---|---|
| Display gamut and DeltaE audit | 3 profiles, 33-patch sweep | 2 h | €90 |
| Thermal stress run | 30 min combined load, IR map | 1.5 h | €75 |
| Battery cycle simulation | 100 partial cycles, capacity log | 24 h | €140 |
| SSD sustained write test | 200 GB linear write, cache map | 3 h | €60 |
| Full unit report | All tests above plus PDF summary | 2 days | €320 |
Full terms and volume rates are on the lab test price list page.
Peak boost lasts seconds and depends on thermal headroom at that moment. Sustained power after 30 minutes is repeatable and predicts long exports, compiles and video calls far better.
Yes. Below 2.0 the shift is not visible in side-by-side comparison. For print proofing, switch to the sRGB mode, which measured 0.9 average.
It added 4 W of sustained package power and dropped the deck by 3.1 °C in our test. The gain comes from intake clearance, not from active airflow.
Two working days, mostly because the battery block runs overnight. Individual tests are returned the same day they finish.
Section 07
Most of our work comes from procurement teams and IT managers who need a second opinion on a batch of units. The quotes below are reproduced with permission, and the full set with the original measurement attachments is on the field reviews page.
"The 30-minute sustained log matched the printed specification within 2 W. That single page settled a three-week argument with the supplier."
"We sent twelve units for the display audit. Two panels came back at DeltaE 3.4 and were replaced under warranty without any back-and-forth."
"The 300-cycle retention data was the deciding factor in our fleet renewal. We now buy against a measured number instead of a marketing claim."
Send one laptop or a whole batch. You get the raw logs, the PDF report and a direct comparison against the reference numbers published across this hub. No prepayment, invoicing after the results are delivered.