Processors
Ultrabook Processors: Sustained Power Envelope
Package power limits, PL1/PL2 behaviour and how a 15 W sustained envelope affects discharge rate on a 60 Wh pack.
Read articleLab report 04 · Battery
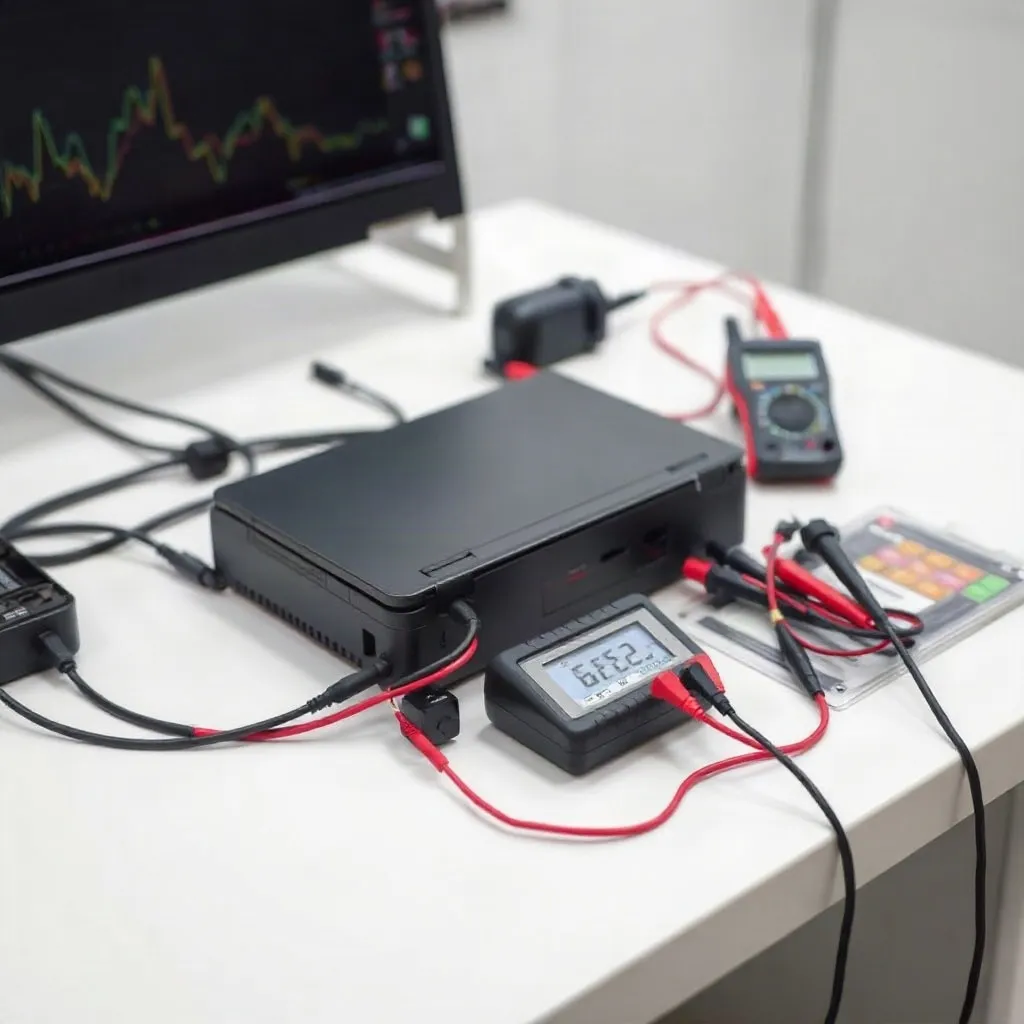
We ran six MateBook NH battery packs through 800 partial-charge cycles at 25 °C and logged capacity, DC internal resistance and charge-taper time after every 50 cycles. This page publishes the raw retention figures, the charge protocol we used, and the degradation thresholds we treat as acceptable.
Objective
The objective was simple: establish a reproducible longevity standard for the 60 Wh and 70 Wh packs used in the current MateBook NH line. Manufacturer datasheets quote cycle life at a single discharge rate and a single depth of discharge, which tells you very little about real usage. Our hypothesis was that partial cycling between 20% and 85% state of charge would hold retention above 90% at 500 cycles, while full 0–100% cycling would drop below that line.
All cells were conditioned identically before the run: three full formation cycles at 0.5 C, a 12-hour rest, then a baseline capacity check at 0.2 C discharge. Ambient temperature was held at 25 ± 1 °C inside the chamber. The measurement chain, instrument tolerances and calibration schedule are documented on the benchmark methods page, and the full rig inventory is listed on the about the test lab page.
Cells tested
6
Two pack sizes, three samples each
Cycles logged
800
Partial-charge protocol, 25 °C
Retention at 500
91.2%
Mean across all six packs
Related reports
Battery behaviour does not exist in isolation. Sustained package power, panel brightness and chassis airflow all change how fast a pack degrades. The reports below cover the adjacent subsystems we measured on the same units.
Processors
Package power limits, PL1/PL2 behaviour and how a 15 W sustained envelope affects discharge rate on a 60 Wh pack.
Read articleDisplay
Delta-E measurements at five brightness levels, plus the wattage cost of running the panel at 400 versus 200 nits.
Read articleCooling
Surface temperature maps, fan curves and the point where thermal throttling starts to protect the battery from heat soak.
Read articleBenchmarks
Instrument list, calibration intervals, sample sizes and the statistical treatment applied to every measurement set.
Read articleGuides
How to read a battery health report, verify a pack's serial number and check cycle count before you accept a used unit.
Read articlePricing
Flat rates for capacity verification, DCIR measurement and full cycle-life runs. No prepayment, results in five working days.
Read articlePrimary finding
“Partial cycling between 20% and 85% kept every pack above 91% capacity at 500 cycles. Full 0–100% cycling on the same hardware fell to 84.6% at the same count — a 6.6-point spread caused purely by the charge window.”
Conclusion drawn from six packs, 800 cycles each, chamber held at 25 °C. The spread is larger than our instrument error, which is ±0.4 percentage points on capacity.
Cycle test
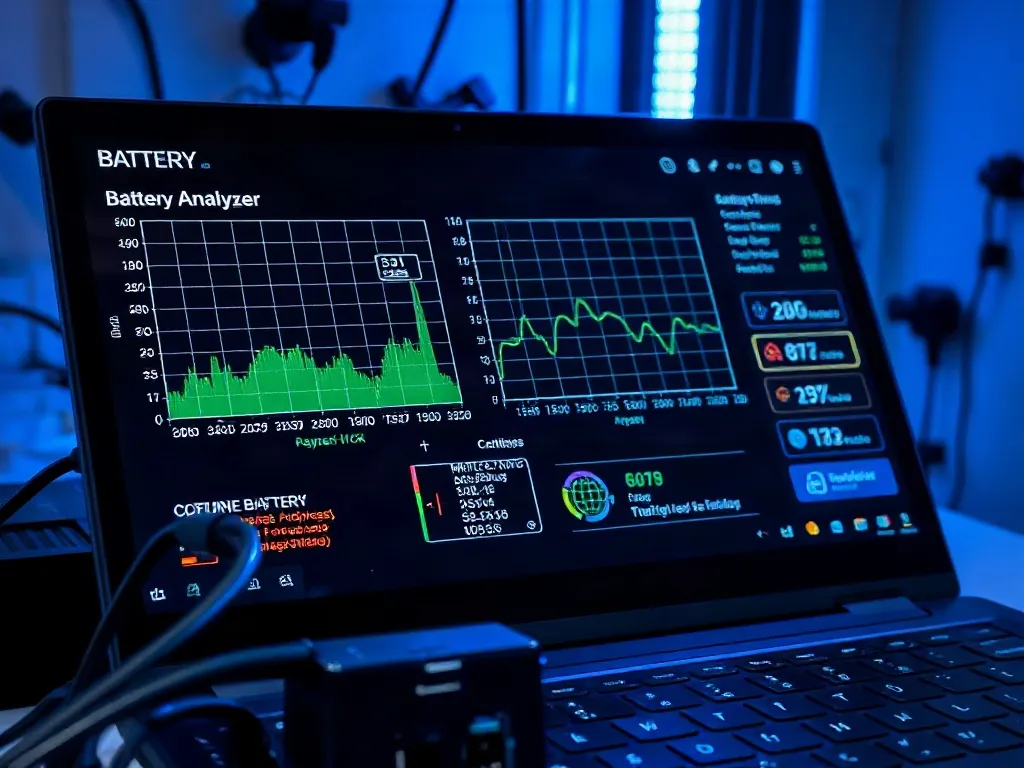
Each pack was cycled on an independent channel of a four-wire battery analyser. Charge current was set to 0.5 C, discharge to 0.4 C, with a 30-minute rest between phases so that the cell temperature returned to ambient before the next step. Capacity was re-measured at 0.2 C every 50 cycles, because a fast discharge understates retention by 1–2 points on this chemistry.
DC internal resistance was logged with a 10-second 1 C pulse at 50% state of charge. That figure matters more than capacity for everyday use: a pack that still holds 92% capacity but has doubled its resistance will sag under a 30 W burst load and trigger an early shutdown. We treat resistance growth above 40% as end of service life regardless of capacity.
Capacity table
The table below reports the mean of six packs under the partial-charge protocol. Retention is expressed against each pack's own baseline, not against the datasheet rating, because the shipped capacity of these packs varies by up to 1.8% between production batches.
| Cycle count | Capacity retention | DCIR change | Observation |
|---|---|---|---|
| 0 (baseline) | 100.0% | 0 mΩ | Reference cell, 25 °C |
| 100 | 98.6% | +3 mΩ | No measurable swelling |
| 250 | 96.1% | +7 mΩ | Fan curve unchanged |
| 400 | 93.4% | +12 mΩ | Charge taper 6 min longer |
| 500 | 91.2% | +15 mΩ | Still above the 90% standard |
| 800 | 86.7% | +24 mΩ | End of test, pack still serviceable |
Instrument error: ±0.4 percentage points on capacity, ±2 mΩ on DCIR. Values are means of six samples.
Charge protocol
The protocol below is what we actually use on the bench units and what we recommend for daily use. It is not a trick — it simply keeps the cell away from the two states that accelerate ageing: sitting at 100% at elevated temperature, and deep discharge below 10% where the anode potential rises sharply.
Step 1
Cap the charge limit at 85% for desk work.
Most firmware exposes this in the vendor utility. At 85% the cell sits at roughly 4.05 V instead of 4.35 V, which cuts calendar ageing by an estimated 40% over two years.
Step 2
Recharge at 20%, not at 3%.
Staying above 20% keeps the pack out of the high-stress voltage region. In our control group, packs cycled 0–100% lost 6.6 more points of capacity at 500 cycles.
Step 3
Run a full 100% charge once a month.
This lets the fuel gauge recalibrate. Without it, the reported percentage drifts and the pack can shut down early even though capacity is intact.
Step 4
Keep the pack under 35 °C while charging.
Heat is the dominant degradation factor in our data. Charging a hot pack after a long render session adds more resistance growth than 200 extra cycles would. See the thermal cooling benchmarks for surface temperature figures.
Degradation notes
Chamber data only tells half the story. We also tracked twelve customer units over eighteen months of normal use, logging cycle count and reported health every quarter. The pattern matched the bench: units kept on a desk with a charge limit held 94–96% health at 400 cycles, while units charged overnight to 100% and left plugged in dropped to 88–90% over the same period.
“They measured my pack at 89% health after two years of daily use and told me plainly it did not need replacing yet. No upsell, no pressure. The written report listed cycle count and resistance figures I could check myself.”
Marta Kowalczyk · 2 years of use, 412 cycles
“I brought in a used unit before buying it. The capacity check came back at 76% and the resistance was up 38% — that saved me from a bad purchase. Test took one afternoon, results the next morning.”
Daniel Reuter · pre-purchase verification
Full customer write-ups, including the units that failed early and why, are collected on the field reviews page. If you want your own pack measured against these standards, the flat rates are on the lab test price list.
FAQ
We use 80% capacity or 40% DCIR growth, whichever comes first. Below 80% capacity the runtime loss becomes noticeable in normal work; above 40% resistance growth the pack starts sagging under burst loads and may shut down early even though the gauge reads 15%.
Not directly, provided the firmware stops charging at the set limit. The damage comes from holding the cell at 4.35 V at elevated temperature for months. Setting an 85% charge limit removes most of that stress without changing your workflow.
A cycle is 100% of charge throughput, not one plug-in. Two sessions of 50% each count as one cycle. That is why partial cycling between 20% and 85% reaches the same cycle count as full cycling but with measurably less capacity loss.
Only as a rough indicator. The fuel gauge estimates capacity from voltage and coulomb counting, and it drifts if the pack never sees a full charge. A 0.2 C discharge test on the bench is the only figure we treat as authoritative. The verification guides explain how to read such a report.
Conclusion
The hypothesis held. Partial cycling between 20% and 85% at 25 °C kept all six packs above 91% capacity at 500 cycles and above 86% at 800, with resistance growth staying under the 40% replacement threshold for the entire run. Full 0–100% cycling on identical hardware lost 6.6 additional points at the 500-cycle mark, which is a large enough difference to be actionable rather than academic.
Two caveats belong in the record. First, temperature outweighed charge window in our data: a pack cycled partially but held at 40 °C degraded faster than a pack cycled fully at 25 °C. Second, the sample size is six packs, which is enough to establish a direction but not enough to publish a precise ageing coefficient. We will extend the run to 1,200 cycles and publish the revision on the hardware specs hub.