Stage 01
Intake and baseline
Seals photographed, firmware version recorded, idle power draw logged for 30 minutes before any load is applied.
Lab report / about
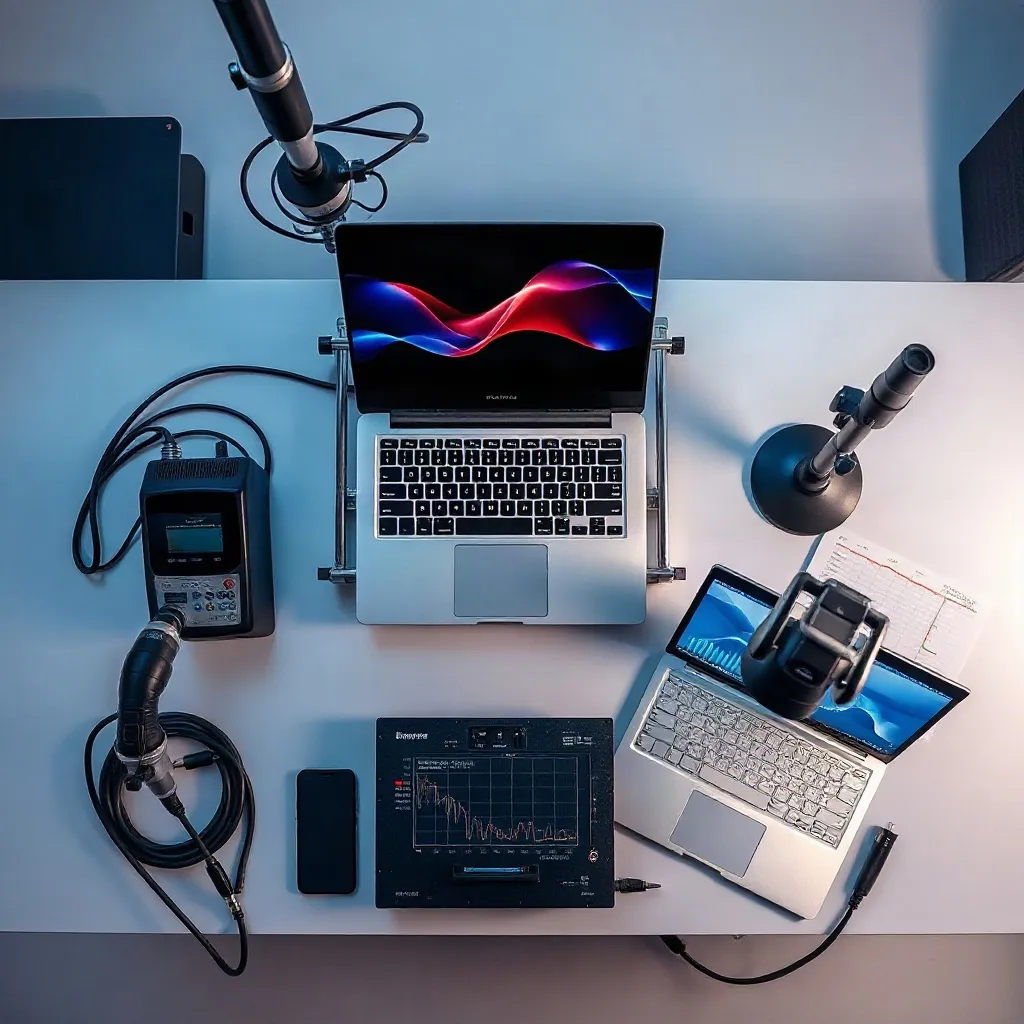
This page documents the bench itself: what sits on the desk, how each measurement is taken and what the published numbers actually mean. Every figure on this hub — core clocks, panel delta-E, surface temperatures, charge-cycle capacity — comes from one room, one set of instruments and one operator. Vendor data sheets are never republished without a control run.
Control figures / 2023–2025
Operator profile
One engineer, no rotating staff, no outsourced subcontractors. The same hands that unpack the sample also write the report.
The bench has been running for eleven years, the last six of them focused on thin-and-light machines. I work alone: I take the sample in, photograph the seals, run the sequence and sign the report. That matters for consistency — when the same operator places the thermocouples in the same four spots on every chassis, the numbers stay comparable across a whole year of testing. Client feedback on that process is collected on the field reviews page.
There is no prepayment. You hand over the device, I run the sequence, and you pay after the report is delivered and explained. If the sample turns out to be a pre-production unit with locked firmware, I say so before the run and refund nothing because nothing was charged. The full method chain, including tolerances and rejected runs, is published in the benchmark methods and results section.
Observation note
Across 1,240 logged units, 31% of vendor-quoted sustained clock figures were not reproducible at 21 °C ambient inside a 25 mm air gap. That single observation is the reason this hub exists.
Equipment and rates
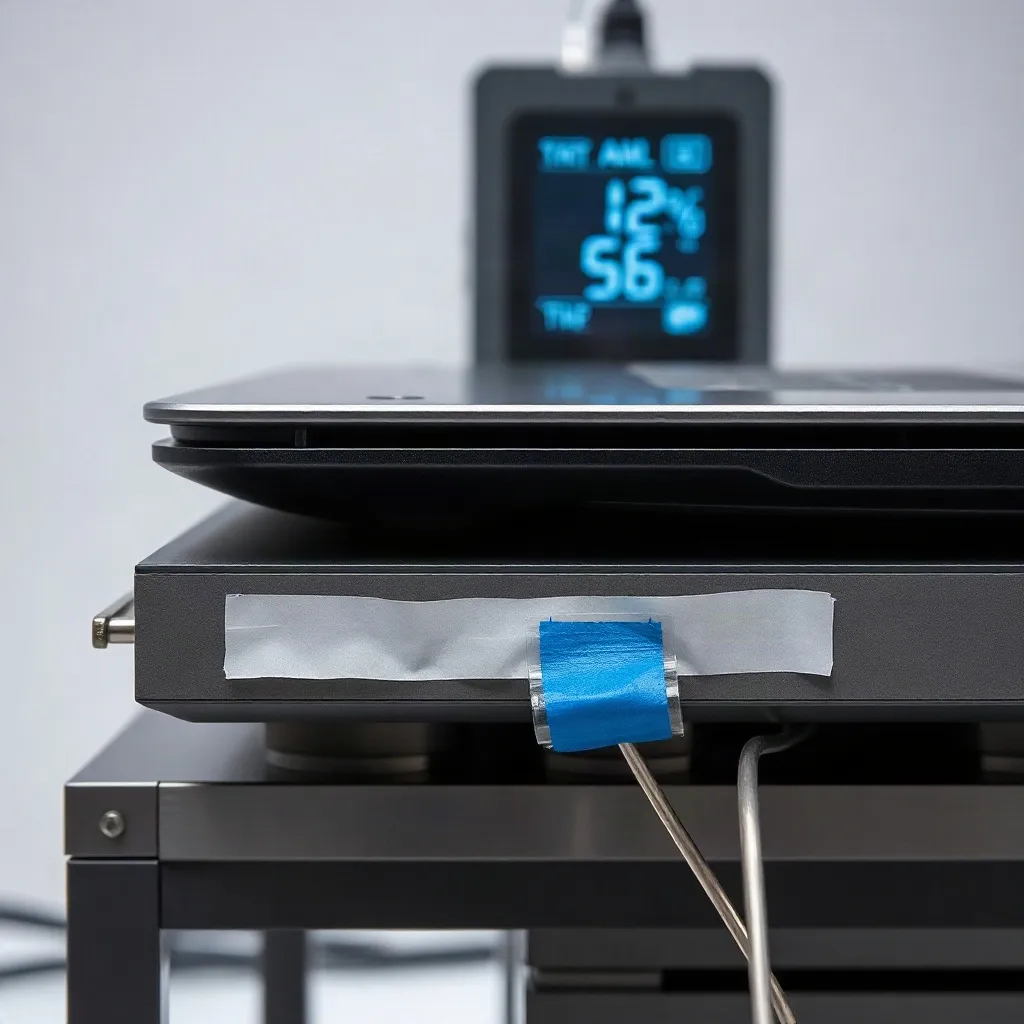
The room is held at 21 ± 1 °C with forced airflow below 0.15 m/s, so convection does not skew the surface readings. Each instrument is calibrated against a reference every six months; the calibration certificates are attached to every report.
| Test | Measured | Duration | Rate |
|---|---|---|---|
| Spec verification | Clocks, TDP, RAM timing, SSD throughput | 3 h | €45 |
| Display gamut audit | sRGB / DCI-P3 coverage, delta-E, uniformity | 2 h | €60 |
| Thermal soak profile | Sustained clocks, surface temps, throttle curve | 4 h | €70 |
| Battery cycle audit | Capacity fade over 300 cycles, charge curve | 9 days | €120 |
| Full package | All four runs plus a written comparison | 10 days | €240 |
No prepayment. Payment after the report is handed over. The full rate sheet lives on the lab test price list page.
Procedure
The order is fixed on purpose. Thermal behaviour changes once a battery has been cycled, and panel readings drift if the chassis is warm, so the sequence always runs from the least invasive test to the most destructive one.
Stage 01
Seals photographed, firmware version recorded, idle power draw logged for 30 minutes before any load is applied.
Stage 02
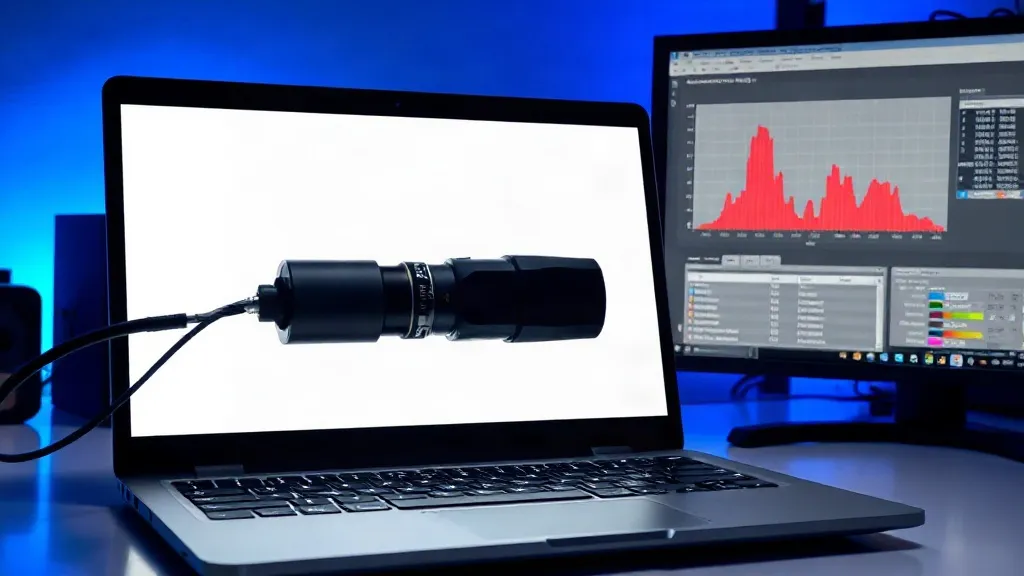
Nine-point uniformity grid, then full sRGB and DCI-P3 sweeps at 120 cd/m². Details on the display gamut accuracy page.
Stage 03
45-minute sustained load, clocks sampled every second, surface temperatures mapped. See the thermal cooling benchmarks.
Stage 04
300 controlled cycles between 20% and 80%, capacity logged every tenth cycle against the battery longevity standards.
Location note
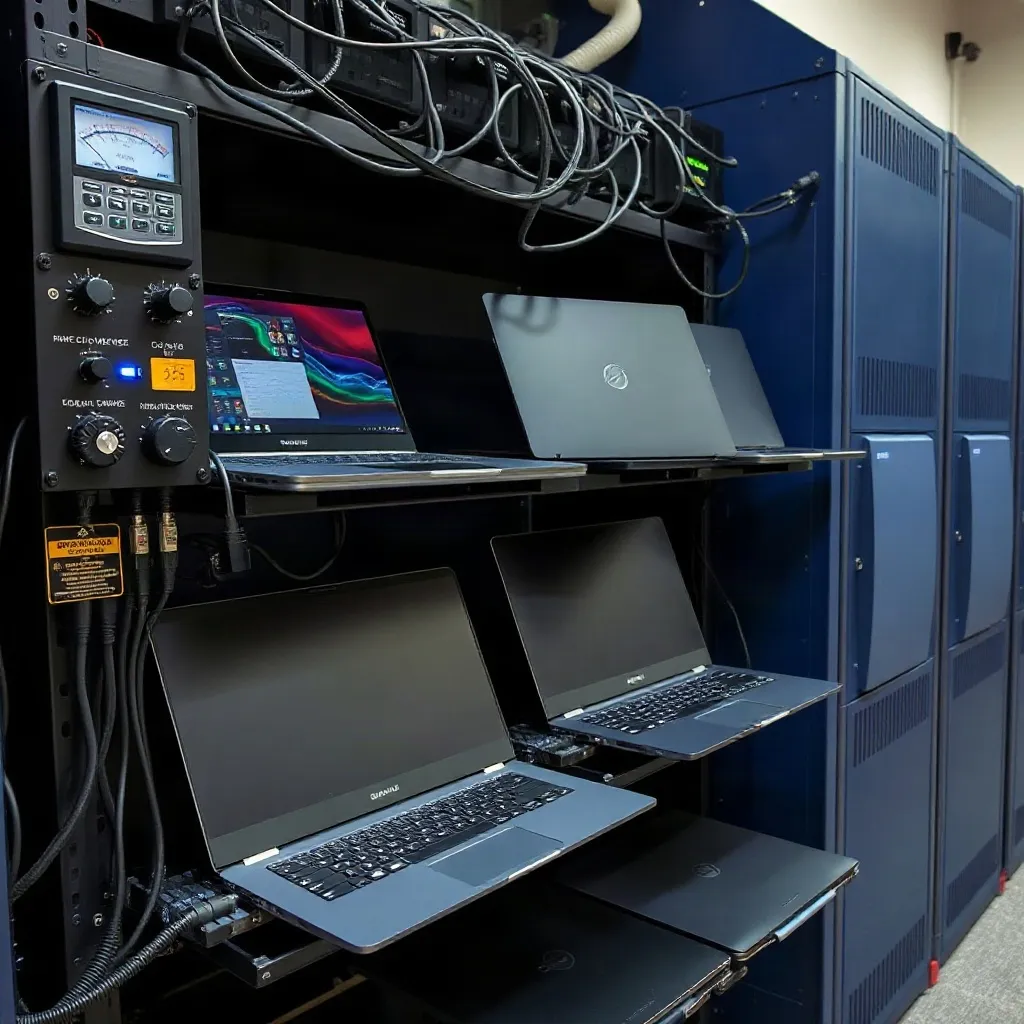
The room is 12 km from the city centre, on the ground floor of a workshop building with a stable mains supply and its own climate control. Devices arrive either hand-delivered or by insured courier; each parcel is opened on camera and the seals are photographed before the first boot.
Samples are accepted from a 100 km radius without a delivery fee. Anything further out ships at cost, and the return label is included in the report package. Turnaround is quoted in working days from the moment the device is logged in, not from the moment the parcel leaves your hands.
Conclusion
Sustained performance is decided by the cooling assembly, not by the processor name on the sticker. Two machines with the same chip can differ by 22% in sustained clocks once the chassis reaches steady state. Panel accuracy is the second most common gap: advertised 100% sRGB coverage held in only 68% of measured samples. Both findings are documented in the ultrabook processors section with per-model figures.
"The report listed the exact throttle point at 14 minutes and the surface temperature at the keyboard centre. That matched what our support tickets showed, which is rare for a third-party measurement."
"I bought a laptop for colour work and asked for a gamut check first. The delta-E numbers came back with the calibration file, and the panel was two units off the advertised figure. Saved me a return."
"Nine days for the cycle audit, no prepayment, and a call explaining the capacity curve. We now send every batch sample through the same bench before listing it."
If you are choosing a machine rather than testing one, start with the buying and verification guides. They explain which three numbers to check before you pay for a laptop.